Command center
One page that says how it is going.
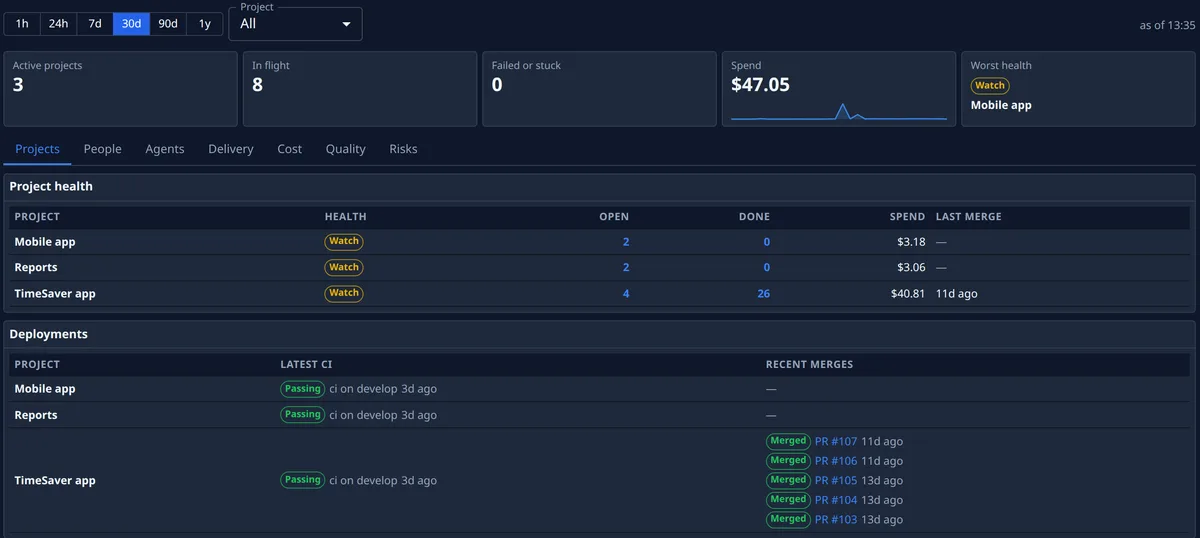
Each project: Healthy, Watch or At risk.
See at once which project needs you, over any range from the last hour to the last year. Five tiles show how many projects are active, what is in flight, what failed or is stuck, what the work has spent and which project is in the worst state. A project’s health is the worst of its factors: failed tasks, long waits, merge failures, spend against its usual level, days since a task moved and its latest build. Hovering a project’s health names each factor. Under the tiles sit each project’s latest build and recent merges, read from GitHub, GitLab, Bitbucket or Azure DevOps.
- From the last hour to the last year, one project or all
- Healthy, Watch or At risk, every factor named
- Latest builds and recent merges, per project
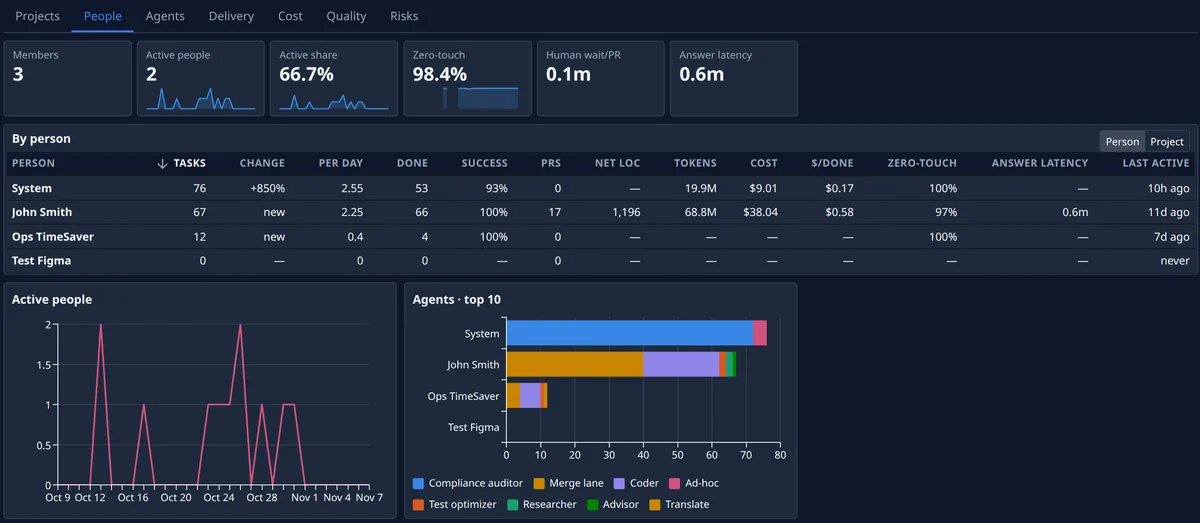
Who uses the agents, and how much they hand over.
Adoption, person by person: the tasks each member filed and saw done, how many succeeded, the changes merged and the net lines changed. Then what it cost: the tokens, the spend and the spend per finished task. You also see how much of each person’s work ran with no one touching it, and how quickly they answered an agent’s question. Members with no activity appear too, and the Project view gives one row per project.
- Tasks, successes, merges and cost, per person
- The hands-off share, and how fast questions are answered
- By person or by project
Every agent’s record: in flight, done, spent.
Each agent with work in the range shows what it has in flight, what it finished, how often it succeeded and what it spent, and its name opens the tasks it ran. With agent performance on your plan, each agent’s best-ranked setup sits beside the one it runs now, by success and cost per success, and one button makes the better one its default. With intelligent routing on your plan, the page compares the router’s pick for each task with the default.
- In flight, done, success rate and spend, per agent
- Its name opens the tasks it ran
- With agent performance, its best setup beside it

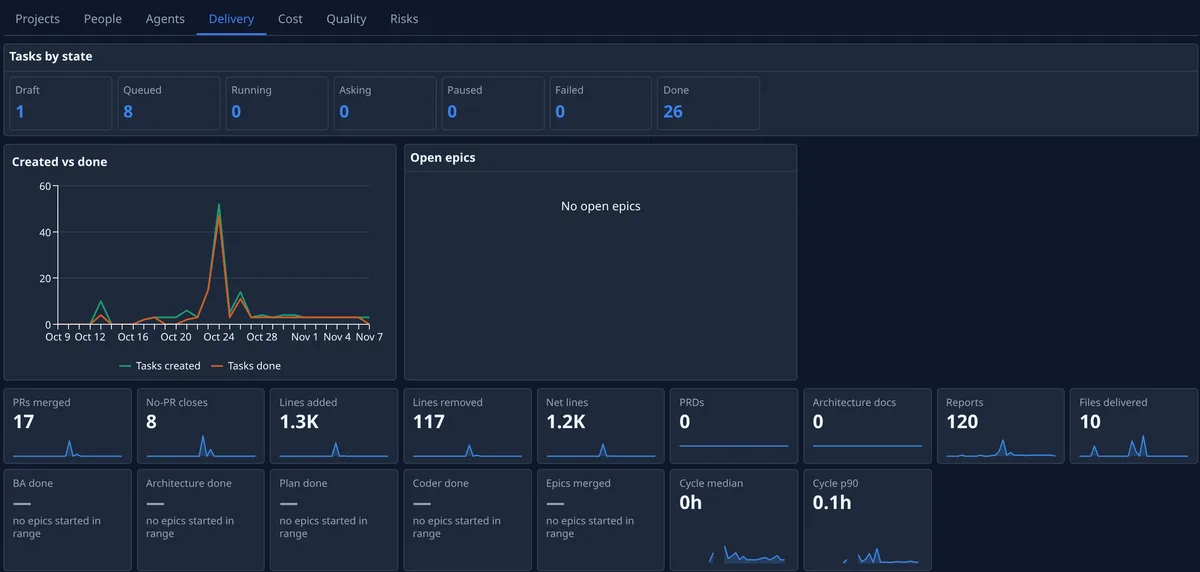
From filed to merged, counted.
See whether the work lands as fast as it is filed: tasks created against tasks done over the range, and tasks by state, each count opening the board on that state. Then what came out: changes merged, tasks closed with nothing to merge, lines changed, epics merged, reports and files delivered, and how long a task takes from start to finish.
- Tasks by state, created against done
- Changes merged, and tasks closed with nothing to merge
- Merges, lines, reports and time to finish
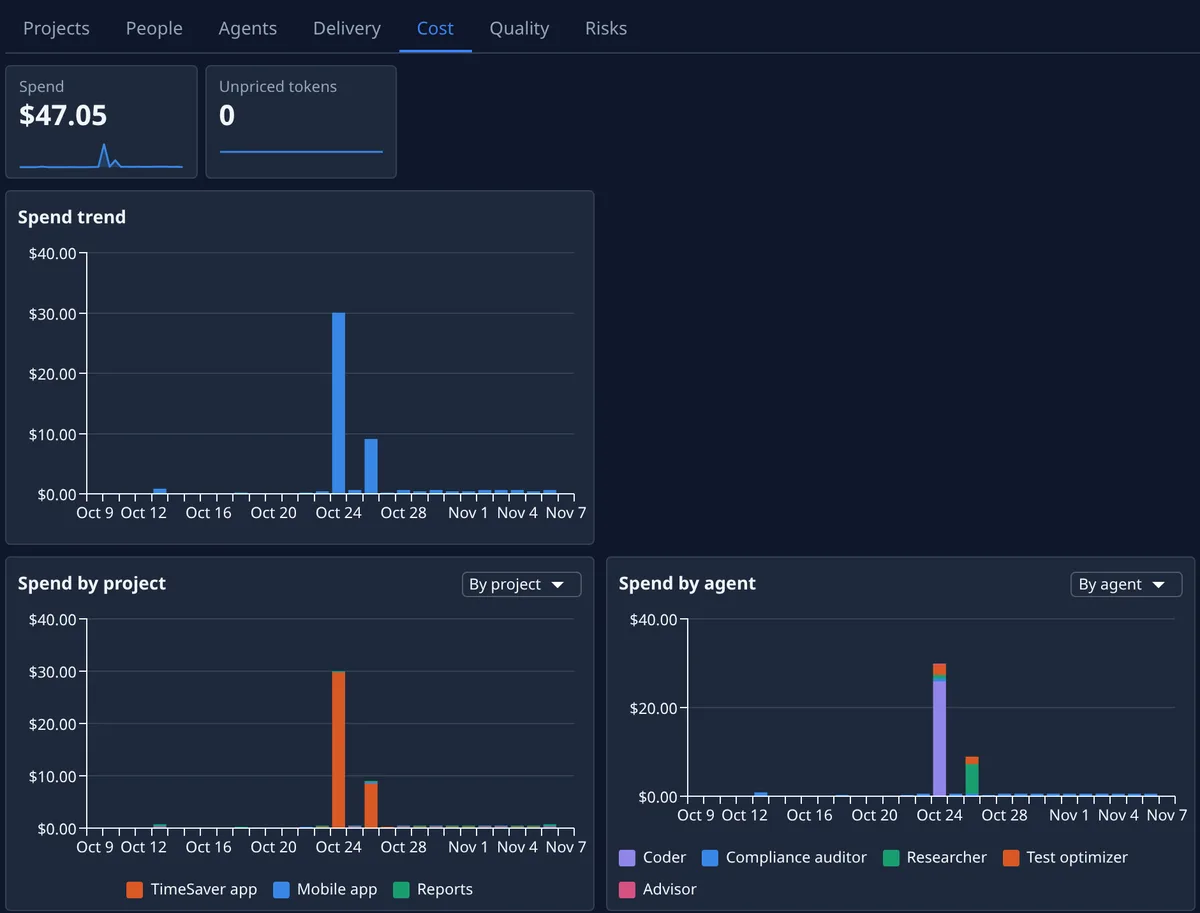
What the work cost, and where it went.
AI spend over the range and its trend, split by project, by agent and by model; a model with no price shows its tokens instead. It also shows tokens, retries and the failure rate, the quota on your own model accounts, the cost of each merged change, each thousand lines and each epic, and what was spent on work that failed.
- Spend by project, agent and model
- Cost per merged change, per thousand lines, per epic
- What was spent on work that failed
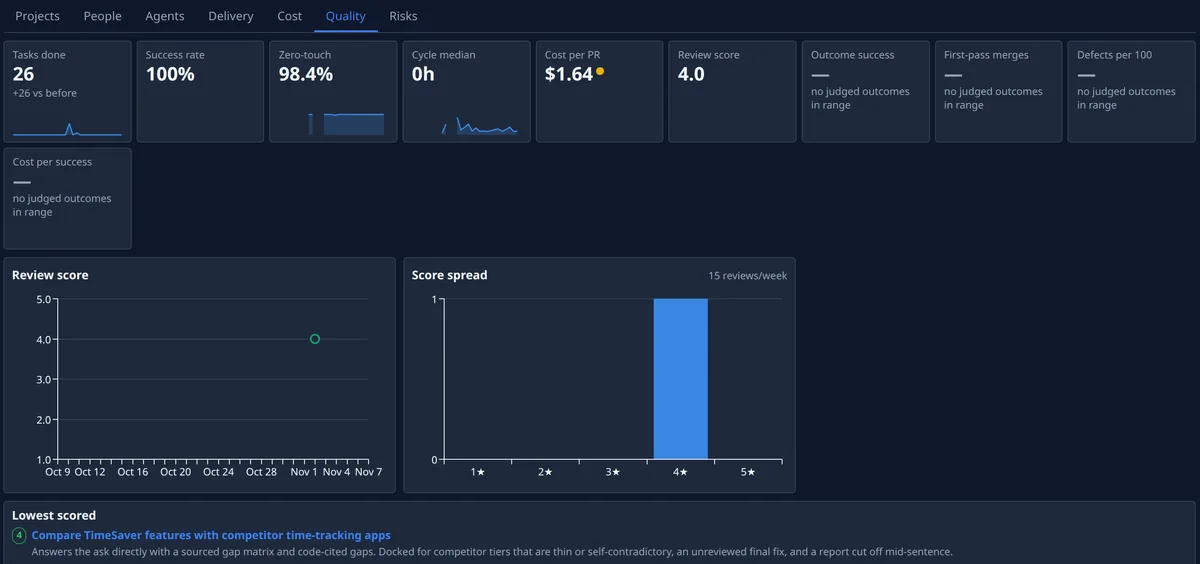
How good the work was, scored every week.
Every week an AI review scores the finished work from one to five; the page charts the score and its spread and lists the lowest-scored work with the reviewer’s reason. Beside it sit tasks done, success rate, the hands-off share, the median time a task takes and the cost per merged change, each against the range before. With agent performance on your plan, compare setups side by side and rank them all.
- Each figure against the range before
- A weekly review score, from one to five
- The lowest-scored work, with the reason
Command center
When something goes wrong, and where the numbers start.
What needs a person, with its reason.
The Risks tab lists the work that needs someone, and every measure that has moved away from its usual level.
- Bugs and risks: failed tasks, tasks waiting on a person or paused too long, merge failures and sessions that broke off, each with its reason and age
- Anomalies: each measure off its usual level, such as cost, tasks created or failure rate, shown beside its usual value
- A weekly digest: an AI summary of what changed in the organisation last week
Every number, read from the work itself.
Each figure is read from your organisation’s own work: its tasks, the builds and merges on its repositories, and the quota on the model accounts it connected.
- A figure with no data shows a dash, and hovering it says why
- The address keeps the range, the project and the tab, so a shared link opens the same view
- Ask the AI assistant what is happening in the company today, and it answers from the same figures
Skip the status meeting. Open Reports.
Start free, hand the agents a few tasks and open Reports to see which project needs you first.